TL;DR:
- Patent landscape analysis maps patent data across biotech fields to reveal ownership, innovation trends, and white spaces that inform strategic decisions. It offers a broad, field-wide view unlike patent searches or FTO analyses, which focus on specific documents or legal risks. Continuous monitoring with AI platforms is essential for staying current and supporting R&D, investment, and M&A activities effectively.
Patent landscape analysis is the systematic mapping and interpretation of patent data across biotech fields to reveal ownership patterns, innovation clusters, competitive risks, and white spaces that directly inform strategic decisions. Unlike a standard patent search, which retrieves specific documents, a patent landscape aggregates and visualizes large datasets to produce intelligence that researchers, R&D leaders, and investors can act on. Platforms like IamIP and PatSnap have made this process faster and more granular, turning months of manual review into structured, decision-ready outputs. Understanding the role of patent landscape in biotech is no longer optional for anyone allocating capital or directing a pipeline.
How does patent landscape analysis differ from patent search and FTO?
These three tools address different questions, and conflating them is one of the most common and costly mistakes in biotech IP strategy.

A patent search retrieves prior art or specific documents relevant to a defined query. It answers: "Does this invention already exist?" A patent landscape goes further. It aggregates, classifies, and visualizes large patent datasets to reveal strategic patterns across an entire technology field, not just individual documents. It answers: "Who owns what, where is innovation concentrating, and where are the gaps?"
A freedom-to-operate (FTO) analysis is legally focused. It determines whether a specific product can be commercialized in a given jurisdiction without infringing active patent claims. FTO also accounts for pre-grant applications that may issue during a product's development timeline, making it a forward-looking legal risk tool. It answers: "Can we sell this without getting sued?"
The three analyses are complementary, not interchangeable. A landscape gives you the wide-angle view of a technology field. FTO narrows to a specific product and jurisdiction. A validity search challenges the strength of individual claims. Running only one of these and assuming it covers the others is how biotech teams walk into expensive surprises.
| Analysis Type | Primary Question | Scope | Strategic Use |
|---|---|---|---|
| Patent landscape | Who owns what, and where is innovation heading? | Broad, field-wide | R&D prioritization, competitive intelligence |
| Patent search | Does this invention already exist? | Narrow, document-level | Prior art, novelty assessment |
| FTO analysis | Can we commercialize without infringing? | Jurisdiction-specific | Commercialization risk, legal clearance |
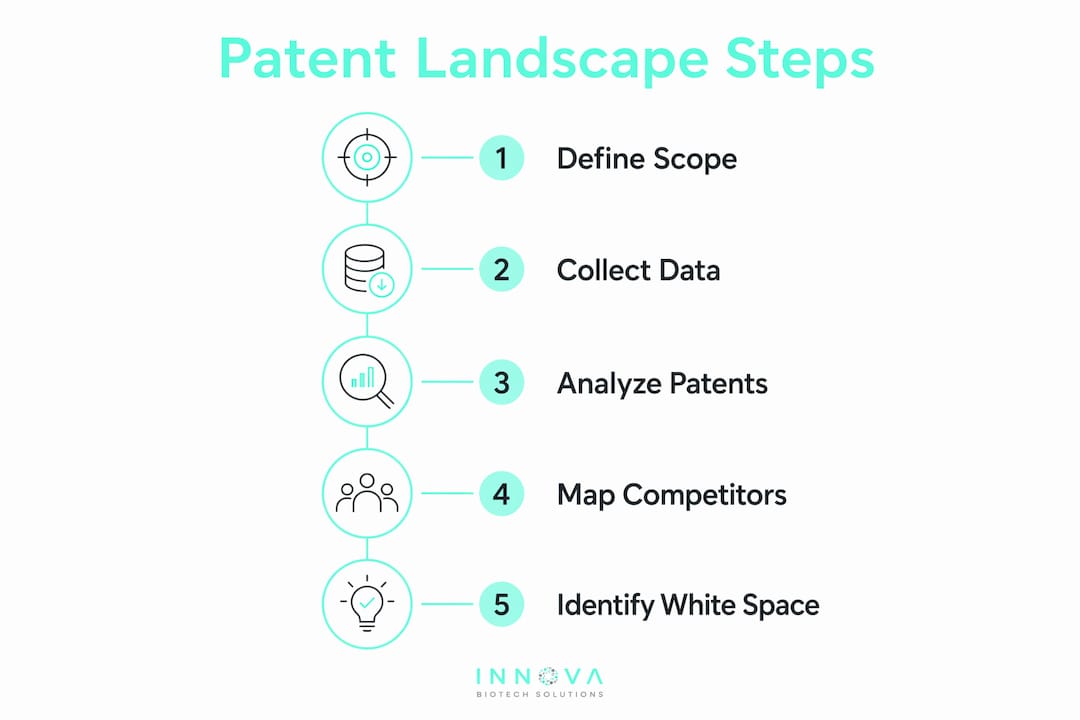
Pro Tip: Scope your landscape by technology, modality, geography, and a defined timeframe before you start. Without those boundaries, you generate noise rather than signal, and the analysis loses its strategic value.
What strategic insights does a biotech patent landscape reveal?
A well-executed patent landscape turns patent ecosystems into actionable intelligence for leadership, R&D teams, and business development functions. The outputs go well beyond knowing who filed what.
The most immediate value is mapping dominant players and their technology focus areas. In CRISPR-based therapeutics, for example, a landscape immediately surfaces the concentration of filings between Broad Institute, UC Berkeley, and their respective licensees. That ownership map tells you where freedom to operate is constrained and where licensing conversations are unavoidable before you commit R&D resources.
Beyond ownership, landscapes track filing velocity over time. A spike in filings in a specific modality, such as lipid nanoparticle delivery for RNA therapeutics, signals where the industry is placing its bets. Spotting that trend 18 months before it becomes consensus gives your team a meaningful head start in either joining the space or differentiating away from it.
White space identification is where landscapes generate the most underappreciated value. These are technology areas with genuine unmet need but low patent density, meaning limited prior art and fewer blocking positions. For early-stage biotech companies, white spaces represent the clearest path to building a defensible IP position without immediately colliding with entrenched portfolios. For investors, they signal where a portfolio company may have room to build durable exclusivity.
- Ownership mapping: Identify which organizations hold dominant positions in your target technology area
- Innovation clustering: Detect where filing activity is concentrating across therapeutic modalities, delivery mechanisms, or target classes
- Filing velocity trends: Track year-over-year changes in application rates to anticipate where competition is intensifying
- White space detection: Locate technology areas with low patent density relative to scientific activity, signaling opportunity
- Partnership scouting: Identify organizations with complementary patent positions that could support licensing or co-development deals
Understanding which biotech targets are being patented alongside landscape data gives R&D teams a sharper picture of where the competitive frontier actually sits.
Pro Tip: When you identify a white space, cross-reference it against recent scientific literature. If publications are dense but patents are sparse, that is a genuine opportunity. If both are sparse, the space may be scientifically immature rather than strategically open.
How do patent cliffs and expirations shape biotech investment and M&A?
A patent cliff occurs when a drug's primary composition-of-matter patent expires, opening the market to generic or biosimilar competition and triggering rapid revenue erosion. In biotech, these events are not gradual. Revenue can drop 80 to 90 percent within two years of expiration for blockbuster biologics.
The EY 2026 Biotech Beyond Borders Report identifies looming patent cliffs as a primary driver of increased M&A activity, as large pharma and biotech companies seek to replace expiring exclusivities with acquired pipelines. This means patent timeline data is not just an IP concern. It is a direct input into deal valuation and acquisition targeting. Companies with assets whose core patents expire in the next three to five years face a compressing window to either extend exclusivity through lifecycle management or find an acquirer willing to pay for remaining market time.
Patent expirations spur M&A surges as strategic acquirers prioritize assets that can replenish finite exclusivity windows. For investors, this creates a specific due diligence requirement: map every patent in a target company's estate against its clinical development timeline to identify where exclusivity gaps exist before a deal closes.
"Patent landscape timing analysis is the mechanism that connects IP data to revenue forecasting. Without it, you are valuing a biotech asset without knowing when the clock runs out."
| Patent cliff scenario | Landscape intelligence needed | Business implication |
|---|---|---|
| Core patent expiring within 3 years | Remaining life, continuation filings, biosimilar filings | Urgent lifecycle management or exit strategy |
| Formulation/method patents only | Strength of secondary claims, litigation history | Weaker exclusivity, higher biosimilar risk |
| Patent estate with 10+ years remaining | White space around core claims | Strong basis for valuation premium |
| Crowded competitive landscape | Blocking patents, FTO constraints | Licensing costs reduce margin projections |
Pro Tip: Always map patent expiry dates against Phase III completion timelines. A drug that achieves approval with only two years of core patent life remaining has a fundamentally different commercial profile than one with eight years. That gap should be reflected in your valuation model.
What tools and approaches support continuous patent monitoring in biotech?
Static patent landscape reports have a short shelf life in fast-moving biotech sectors. A landscape completed in January can be materially outdated by June if a major competitor files a cluster of continuation applications or a new entrant enters the space. Continuous monitoring with automated alerts is now standard practice for teams that need current intelligence rather than historical snapshots.
AI-powered platforms have changed the economics of ongoing monitoring. PatSnap's AI-enabled analytics allow biopharma business development teams to identify patent clusters and monitor new filings in near real time, extracting compound data and benchmarking assets without the manual overhead of traditional reviews. IamIP offers similar functionality with structured landscape outputs designed for strategic rather than purely legal use. Both platforms reduce the time from patent publication to strategic awareness from weeks to days.
Setting up an effective monitoring program requires four defined parameters:
- Technology scope: Define the specific technology class, target family, or modality you are tracking. Broad definitions generate too much noise; narrow definitions miss adjacent threats.
- Geographic scope: Prioritize the jurisdictions where you plan to commercialize or where key competitors are filing. USPTO, EPO, and CNIPA cover the majority of strategically relevant filings.
- Time window: Set a baseline date and configure alerts for new publications from that point forward. Monthly refreshes are the minimum cadence for active development programs.
- Entity tracking: Monitor specific assignees, inventors, and CPC classification codes relevant to your technology area.
Persistent monitoring programs incorporating automated alerts and periodic refreshes represent best practice in biotech patent intelligence. The goal is early signal detection, not comprehensive annual reviews that arrive too late to influence decisions. Teams that integrate monitoring outputs into quarterly R&D reviews consistently make faster, better-informed decisions about where to invest and where to pivot.
How do patent landscapes inform investor due diligence and portfolio strategy?
Patent counts alone tell investors almost nothing useful. A portfolio with 200 patents may be weaker than one with 20 if the larger estate consists of narrow method claims while the smaller one holds broad composition-of-matter protection on validated targets. Investor due diligence requires mapping patent estates, stress-testing expiry dates against clinical timelines, and evaluating litigation exposure to assess genuine IP strength.
A structured investor due diligence workflow using patent landscape data includes these steps:
- Map the full patent estate. Identify all patents and applications owned by or licensed to the target company, organized by technology area and claim type.
- Assess remaining patent life. Calculate the time between expected approval and core patent expiration. For biologics, also evaluate biosimilar filing activity as a leading indicator of competitive pressure.
- Identify blocking third-party patents. Search for patents held by competitors that could constrain commercialization in key markets, and assess whether FTO clearance has been obtained.
- Review litigation history. Prior inter partes review (IPR) challenges, district court litigation, or licensing disputes signal patent vulnerability and potential future costs.
- Translate landscape data into time-based risk. Patent landscape insights are most useful when aligned with clinical development roadmaps rather than presented as static counts.
- Evaluate white space around core assets. Determine whether the company has room to file continuation or divisional applications that extend protection into adjacent claims.
The structural bioinformatics work that informs protein engineering decisions often generates patentable innovations that only appear in landscape analyses years later. Investors who understand this lag can identify companies building IP positions before those positions are fully visible in public databases.
Early-stage biotech investors should also consider why patenting early-stage ideas matters for portfolio companies, since the filing date establishes priority and shapes the competitive landscape years before commercialization.
Key takeaways
Patent landscape analysis is the most strategically underused tool in biotech IP strategy, and the teams that treat it as continuous intelligence rather than a one-time report consistently outperform those that do not.
| Point | Details |
|---|---|
| Landscape vs. search distinction | Patent landscapes aggregate and visualize field-wide data; searches retrieve specific documents for narrow queries. |
| Patent cliffs drive M&A | Expiring exclusivities are a primary 2026 driver of biotech acquisitions; timeline mapping is a core due diligence step. |
| Continuous monitoring is required | Static reports become outdated within months; AI platforms like PatSnap and IamIP enable real-time alert-based tracking. |
| Investor due diligence workflow | Map estates, stress-test expiry against clinical timelines, and identify blocking patents before committing capital. |
| White space signals opportunity | Low patent density in scientifically active areas indicates where defensible IP positions can still be built. |
Why most biotech teams are using patent landscapes wrong
I have reviewed patent landscape reports produced for biotech companies at every stage, from seed-funded startups to large-cap pharma, and the most consistent failure is scope. Teams either define the landscape so broadly that the output is a 200-page document no one reads, or so narrowly that they miss the adjacent technology areas where their real competitive threats are forming.
The second failure is treating the landscape as a deliverable rather than a process. A report produced in Q1 and filed away does not protect you from a competitor who files a blocking continuation in Q3. The teams that extract the most value from patent intelligence are the ones who have built monitoring into their quarterly R&D rhythm, not the ones who commission a report before a board meeting.
The third thing I have observed is that the most sophisticated biotech investors do not just look at what patents exist. They look at what patents are missing. A company with a strong scientific position but a thin patent estate around its core mechanism is a company that either has not prioritized IP or has not been able to get broad claims granted. Both scenarios carry risk that a simple patent count would never surface.
AI tools have genuinely changed what is possible here. The combination of automated monitoring, semantic claim analysis, and competitive benchmarking that platforms like PatSnap now offer would have required a team of analysts five years ago. That shift makes continuous patent intelligence accessible to organizations that previously could only afford periodic reviews. The teams that adopt this approach earliest will have a structural advantage in both R&D prioritization and deal-making for the next decade.
— Hooman
How Innovabiotech supports your patent-informed R&D strategy
Innovabiotech combines deep computational biology expertise with a clear understanding of the patent environment shaping biotech innovation today. Whether you are building a defensible IP position around a novel peptide, evaluating a target for its competitive landscape, or stress-testing a pipeline asset before a funding round, Innovabiotech's team brings the scientific precision your decisions require.

From peptide design and optimization to virtual screening and protein engineering, Innovabiotech delivers tailored solutions that align with both your scientific goals and your IP strategy. Every project is handled with full transparency from initial consultation through delivery. Contact Innovabiotech to discuss how advanced bioinformatics and computational biology can accelerate your next program.
FAQ
What is patent landscape analysis in biotech?
Patent landscape analysis is the systematic aggregation, classification, and visualization of patent data across a technology field to reveal ownership patterns, innovation trends, and white spaces. It differs from a patent search by providing strategic field-wide intelligence rather than retrieving specific documents.
How does a patent landscape differ from a freedom-to-operate analysis?
A patent landscape provides a broad strategic view of an entire technology field, while an FTO analysis focuses on whether a specific product can be commercialized in a given jurisdiction without infringing active patent claims. The two analyses are complementary and address different decision needs.
Why do patent cliffs matter for biotech investors?
Patent cliffs signal imminent revenue erosion when core drug patents expire, and the EY 2026 Biotech Beyond Borders Report identifies them as a primary driver of M&A activity. Investors use patent timeline mapping to stress-test asset value against clinical development milestones before committing capital.
How often should a biotech patent landscape be updated?
In fast-moving biotech sectors, landscapes can become outdated within months, making continuous monitoring with automated alerts the recommended approach rather than annual full reviews. Platforms like IamIP and PatSnap support real-time tracking of new filings and competitor activity.
What makes a biotech patent estate strong for investment purposes?
Patent quality matters more than count. A strong estate includes broad composition-of-matter claims, sufficient remaining life relative to clinical timelines, limited blocking third-party patents, and no significant litigation history that could invalidate core claims.