
Phenotypic drug screening identifies bioactive compounds by observing their functional effects on whole biological systems — cell lines, organoids, or model organisms — without requiring a predefined molecular target. The approach lets biology, not a hypothesis about a single protein, determine which molecules are worth pursuing. Mechanism-of-action (MoA) follow-up is not optional; it is the essential second act that converts a phenotypic hit into a developable lead.
Use phenotypic screening when:
- The disease has no well-validated molecular target, or existing targets have failed in the clinic
- Polypharmacology is desirable (e.g., complex CNS disorders, metabolic disease)
- You are repurposing approved drugs and need functional evidence before committing to a mechanism
- You want to discover the target alongside the drug, using the compound itself as a probe
- A disease-relevant cellular or organismal model exists that recapitulates the human pathology closely enough to be predictive
Plan MoA determination before the primary screen runs, not after hits arrive. Teams that treat target deconvolution as an afterthought routinely stall at the hit-to-lead stage.
Key Takeaways
Phenotypic drug screening has produced more than half of first-in-class approved drugs in the modern era, and its translational advantage depends entirely on choosing disease-relevant models and planning MoA determination before the screen runs.
| Point | Details |
|---|---|
| Definition | Phenotypic screening identifies bioactive compounds by their functional effects on cells or organisms, without a predefined target. |
| 56% of first-in-class NMEs | Between 1999 and 2008, 28 of 50 first-in-class NMEs were discovered phenotypically, not through target-based design. |
| MoA is non-negotiable | Plan at least two complementary MoA methods before the primary screen runs; reactive MoA planning adds 3–6 months of delay. |
| Model choice determines translation | Disease-relevant models (iPSC-derived cells, organoids, patient-derived lines) outperform convenient cell lines for clinical translatability. |
| Innovabiotech | Provides ML-based MoA inference, feature engineering, and hit-to-lead computational support for phenotypic drug discovery programs. |
Table of Contents
- Why did phenotypic drug screening make a comeback?
- How does a phenotypic screening campaign actually work?
- Which biological models should you use for phenotypic assays?
- What readouts and technologies power modern phenotypic screens?
- How do you triage hits after a primary phenotypic screen?
- What MoA methods convert phenotypic hits into validated leads?
- Phenotypic versus target-based discovery: advantages and limitations
- What do published successes tell us about phenotypic screening?
- A practical design checklist for your phenotypic campaign
- How long does a phenotypic campaign take, and what does it cost?
- What should your computational team deliver, and when?
- Common pitfalls in phenotypic campaigns and how to avoid them
- A researcher's perspective on what actually matters in phenotypic campaigns
- Phenotypic screening support from Innovabiotech
- Sources
- FAQ
Why did phenotypic drug screening make a comeback?
Classical pharmacology was always phenotypic: researchers observed what a compound did to a tissue, an animal, or a patient before they knew why. The molecular biology revolution of the 1980s and 1990s shifted the field toward target-based drug discovery (TDD), where a validated protein target is identified first and compounds are screened for binding or inhibition. The logic was compelling: know the target, design the drug. In practice, the translation record was disappointing. Many target-validated compounds failed in the clinic because the target, however well characterized biochemically, did not behave the same way in a diseased human as in a purified assay.
The field's reassessment came with a landmark analysis. Among 50 first-in-class new molecular entities (NMEs) approved between 1999 and 2008, 28 (56%) were discovered through phenotype-based approaches rather than target-directed design. That figure reframed the conversation. It did not argue that TDD was wrong; it demonstrated that phenotypic discovery had been quietly responsible for more than half of the genuinely novel approved drugs during a period when the industry was officially committed to the target-based paradigm.
Several factors drove the resurgence beyond that statistic:
- High-content imaging and automated microscopy made large-scale cell-based screens practical and affordable
- iPSC-derived cells and organoids gave researchers human-relevant disease models that did not exist a decade earlier
- Machine learning tools capable of extracting biological signal from thousands of morphological features per cell turned image data into tractable MoA hypotheses
- A growing recognition that many diseases — neurodegeneration, fibrosis, complex psychiatric conditions — lack a single druggable target that explains the full pathology
The Nature Reviews Drug Discovery perspective on phenotypic drug discovery captures the current consensus: the modality is not a fallback when targets are absent; it is a deliberate strategic choice when the biology is complex enough that a single-target hypothesis is likely to be wrong.
How does a phenotypic screening campaign actually work?
The workflow is sequential but iterative. Every stage has defined go/no-go criteria, and the decision to advance, redesign, or stop should be explicit rather than implicit.
Stage 1: Model and assay selection
- Define the disease-relevant phenotype you want to change (e.g., neuronal survival, beta-cell insulin secretion, pathogen clearance).
- Select the biological model that best recapitulates that phenotype at the throughput you need (see Section 4 for model trade-offs).
- Develop and miniaturize the assay; confirm the phenotype is stable, reproducible, and sensitive to known positive controls.
- Validate assay performance: Z' factor ≥ 0.5 for HTS, signal-to-background ratio, coefficient of variation across plates and days.
Stage 2: Library selection and plating
- Choose a compound library matched to the assay's biology: annotated tool compounds for mechanism exploration, diversity sets for unbiased discovery, or focused sets (e.g., FDA-approved drugs for repurposing). Smaller molecular-weight compounds improve the probability of hits amenable to medicinal chemistry optimization, as reviewed in PMC.
- Plate compounds at a single concentration (a concentration range typically used in screening) with positive and negative controls on every plate; use a randomized plate layout to minimize positional bias.
Stage 3: Primary screen
- Run the screen in singlicate or duplicate; apply strict QC thresholds per plate (Z' ≥ 0.5, controls within 3 SD of historical mean).
- Flag primary hits using a robust statistical cutoff (e.g., median ± 3 × MAD, or a B-score threshold).
- Prefer gain-of-signal assays where practical: they reduce the risk of flagging cytotoxic or stress-inducing compounds as apparent actives.
Stage 4: Hit triage and orthogonal validation
- Retest primary hits in duplicate or triplicate at the original concentration to confirm activity.
- Generate concentration-response curves (8–10 point, half-log dilutions) to establish potency and Hill slope.
- Run counterscreens for cytotoxicity (e.g., CellTiter-Glo, DRAQ7) and assay-specific artifacts (luciferase interference, redox activity, aggregation).
- Apply orthogonal assays that measure the same phenotype through a different readout or mechanism.
Stage 5: Early ADME/Tox and selectivity
- Run microsomal stability, kinetic solubility, and CYP inhibition panels on confirmed hits before investing in MoA work.
- Test selectivity in a relevant counterscreen panel (e.g., off-target cell lines, selectivity assays for the disease indication).
Stage 6: MoA and target deconvolution
- Apply a pre-planned MoA toolbox (see Section 7) in parallel rather than sequentially to avoid bottlenecks.
- Set explicit MoA decision gates: if no credible target hypothesis emerges after two complementary methods, reassess the hit's value before advancing.
QC metrics to track across the campaign: Z' factor per plate, %CV of controls, hit rate per library subset, and inter-plate signal drift. A higher than typical hit rate in a diversity screen may signal assay interference rather than genuine biology.
Which biological models should you use for phenotypic assays?
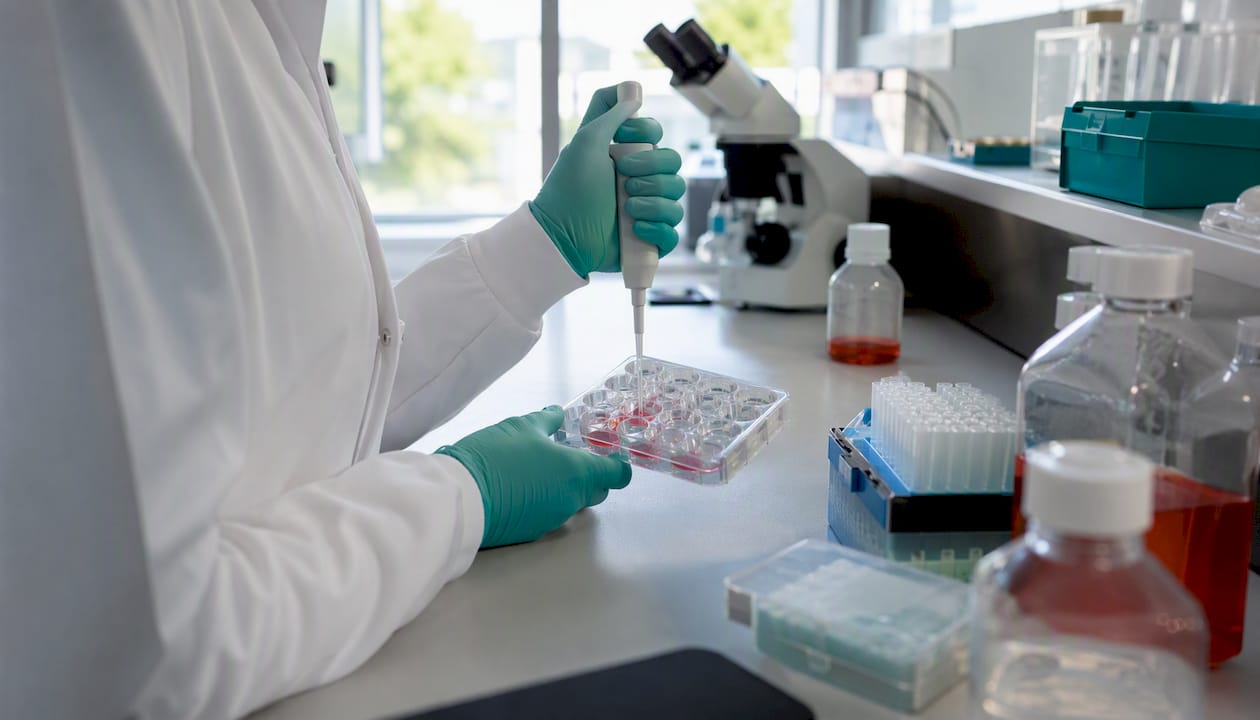
Model choice is the single biggest determinant of whether a phenotypic hit translates to the clinic. Selecting a model with high human relevance rather than chasing the highest throughput is the most important factor influencing long-term success. The trade-offs between scalability, physiological fidelity, cost, and ethical constraints are real, and no model is universally correct.
| Parameter | 2D cell lines | Primary cells | iPSC-derived cells | Organoids | Zebrafish | Rodent models |
|---|---|---|---|---|---|---|
| Scalability | Very high | Moderate | Moderate | Low–moderate | Moderate | Low |
| Physiological relevance | Low | Moderate–high | High | High | Moderate | High |
| Cost per data point | Low | Moderate | High | High | Moderate | Very high |
| Throughput | HTS-compatible | Medium throughput | Medium throughput | Low throughput | Medium throughput | Low throughput |
| Ethical constraints | Minimal | Minimal | Minimal | Minimal | Moderate (vertebrate) | High (vertebrate) |
Key considerations when choosing:
- 2D immortalized cell lines (HEK293, HeLa, cancer lines): fast, cheap, and HTS-compatible, but often lack the signaling context of the disease tissue. Best for mechanism-agnostic primary screens where throughput matters most.
- Primary cells (hepatocytes, neurons, cardiomyocytes): closer to native biology but donor variability and limited passage number complicate reproducibility. Useful for secondary validation of hits from simpler models.
- iPSC-derived cells: patient-specific disease modeling is their real strength, particularly for monogenic disorders. Human iPSC-derived and organoid systems increasingly provide higher-fidelity disease models for indications where rodent biology diverges from human pathology.
- Organoids: three-dimensional, self-organizing structures that recapitulate tissue architecture. Throughput is limited, but the biological fidelity for gut, liver, and brain applications is substantially higher than any 2D equivalent.
- Zebrafish: whole-organism readouts including behavior, cardiac function, and toxicity in a vertebrate system at medium throughput. Translation challenges exist, but zebrafish remain valuable for CNS and cardiovascular phenotypes where whole-organism context is necessary.
- Rodent in vivo models: the highest physiological complexity but the lowest throughput and the greatest ethical burden. Reserve for late-stage validation of confirmed leads, not primary screening.
Pro Tip: Co-culture systems (e.g., neurons plus astrocytes, tumor cells plus immune cells) often reveal compound effects that monocultures miss entirely. If your disease phenotype depends on cell-cell communication, a monoculture assay will systematically underperform.
What readouts and technologies power modern phenotypic screens?
The readout you choose determines how much biological information you extract per compound and how complex your data analysis pipeline needs to be. There is a direct trade-off between information content and analytical burden.
Simple functional assays (cell viability, reporter gene activity, ELISA-based secretion): fast, cheap, and easy to automate. The limitation is dimensionality: one number per well tells you something happened but nothing about what. Best as primary screens or counterscreens, not as the sole basis for hit prioritization.
High-content imaging (HCI): automated fluorescence microscopy combined with image analysis software (e.g., Columbus, CellProfiler, Harmony) extracts dozens to hundreds of morphological features per cell per well. HCI can simultaneously measure cell count, nuclear morphology, cytoskeletal organization, and organelle distribution in a single assay. The data volume is substantial, and batch correction and normalization are non-negotiable before any downstream analysis.
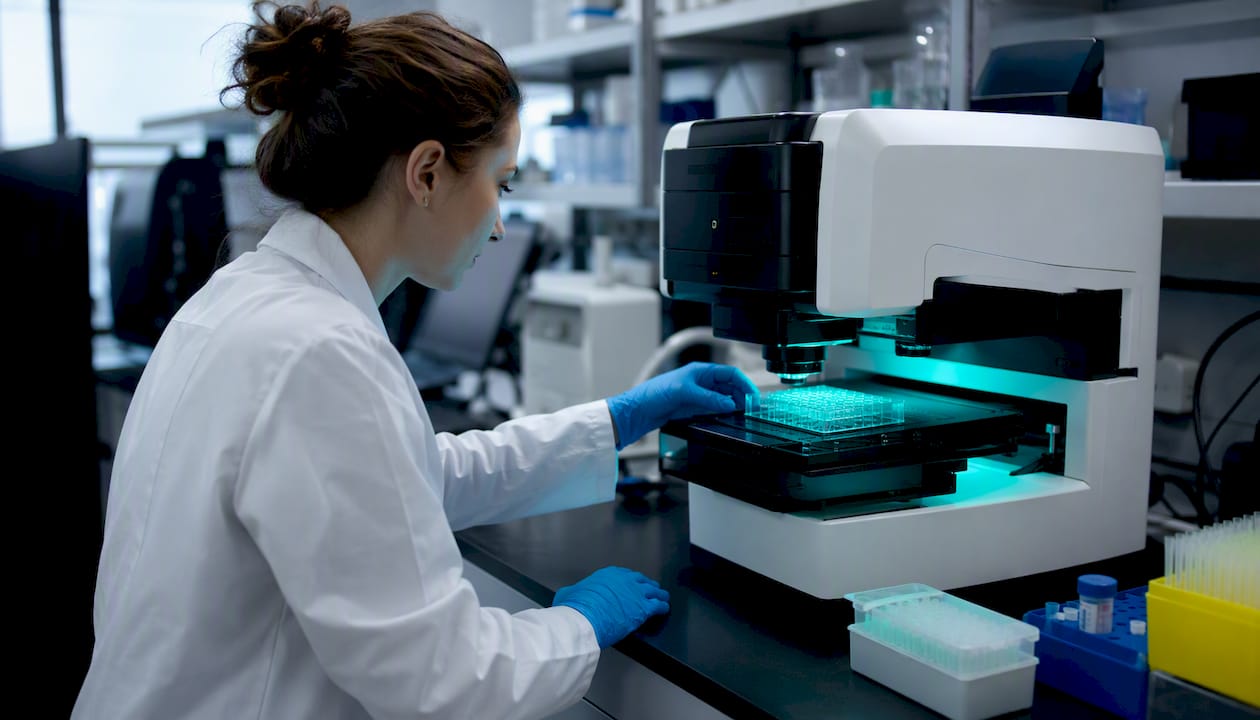
Cell Painting: a multiplexed morphological profiling approach that stains six cellular compartments with five fluorescent dyes and extracts over a thousand features per cell. Cell Painting profiles can be used for clustering, signature matching, and MoA hypothesis generation when combined with ML and reference databases. The Broad Institute's JUMP-CP dataset has made large-scale reference profiles publicly available, which means your hits can be compared against thousands of annotated compounds without running additional experiments.
Transcriptomics and proteomics readouts (bulk RNA-seq, single-cell RNA-seq, mass spectrometry-based proteomics): the highest-information readouts available. They are expensive, slow, and analytically demanding, which makes them impractical for primary screens of large libraries. Their value is in secondary profiling of confirmed hits to generate mechanistic hypotheses before committing to a full MoA campaign.
Electrophysiology (multi-electrode arrays, patch clamp): indispensable for cardiac and neuronal phenotypic screens where electrical activity is the relevant output. Throughput is lower than imaging-based methods, but the functional specificity is unmatched for ion channel or action potential phenotypes.
Behavioral readouts in model organisms: locomotion, sleep, feeding, and social behavior in zebrafish or flies provide whole-organism functional data that no cell-based assay can replicate. Automated tracking systems (e.g., ZebraLab, EthoVision) have made these assays more quantitative, though inter-experiment variability remains a challenge.
Advances in high-content imaging, organoids, machine learning, and computational phenotype representations have made phenotypic drug discovery more systematic and data-driven, substantially improving the translational potential of hits identified in cell-based systems.
Data analysis steps for high-content readouts:
- Feature extraction from raw images (CellProfiler, Harmony, or proprietary platforms)
- Per-plate normalization (DMSO-normalized percent activity or robust z-score)
- Batch correction across plates and days (ComBat, RUV, or plate-median normalization)
- Dimensionality reduction (PCA, UMAP) to visualize compound clustering
- Clustering and nearest-neighbor analysis to group compounds by phenotypic similarity
- Comparison against reference databases (JUMP-CP, L1000 signatures) for MoA inference
How do you triage hits after a primary phenotypic screen?
Primary screens generate noise. A structured triage process separates genuine actives from artifacts before any resource-intensive MoA work begins.
Stepwise hit triage checklist
- Retest at original concentration in triplicate, ideally on a different day and by a different operator. Compounds that do not reproduce at ≥ 70% of original activity are deprioritized.
- Concentration-response curves (CRC): run 8–10 point, half-log dilutions. Flag compounds with Hill slopes > 3 (aggregators) or incomplete curves (poor solubility). Confirm IC50 or EC50 values are within a tractable range (typically < 10 µM for a starting point).
- Cytotoxicity counterscreen: run a parallel viability assay (CellTiter-Glo, DRAQ7, or equivalent) at the same concentrations. Any compound where the cytotoxicity CC50 is within 3-fold of the active EC50 is deprioritized unless the phenotype is explicitly cell death.
- Assay-interference counterscreens: test for luciferase inhibition (if the primary assay uses a luciferase reporter), redox activity (DCFH-DA assay), and colloidal aggregation (dynamic light scattering or detergent sensitivity test). These three artifact classes account for a disproportionate share of false positives in cell-based screens.
- Orthogonal assay confirmation: measure the same phenotype through a mechanistically independent readout. If the primary assay is a reporter gene, confirm with an endogenous protein readout (e.g., ELISA, Western blot, or immunofluorescence). Agreement between orthogonal assays is the strongest evidence of genuine activity.
- Selectivity panel: test confirmed hits in a panel of cell lines or assays representing off-target biology relevant to the indication. A compound that is active in every cell line regardless of the phenotype of interest is almost certainly non-selective.
When to run early ADME/Tox
Run microsomal stability (human liver microsomes), kinetic solubility, and CYP3A4/2D6 inhibition before committing to MoA work. These assays cost a fraction of a chemoproteomics experiment and will eliminate compounds that cannot survive in vivo regardless of their phenotypic potency. A hit with a half-life of under 5 minutes in human liver microsomes is not a lead candidate, no matter how clean its cellular profile looks.
Common orthogonal assays and what they rule out:
- Luciferase interference assay: rules out compounds that inhibit the reporter enzyme rather than the biology
- PAINS filters (computational): flags pan-assay interference scaffolds (quinones, rhodanines, Michael acceptors)
- Aggregation assay (DLS or detergent sensitivity): rules out colloidal aggregators that non-specifically sequester proteins
- Counterscreen in a cell line lacking the target pathway: rules out non-pathway-specific cytostatic effects
What MoA methods convert phenotypic hits into validated leads?
MoA determination is where phenotypic campaigns most often stall. No single method suffices for all cases; successful campaigns use an integrated toolbox of affinity methods, genetic screens, expression profiling, and computational inference. The table below maps each method to its best use case, strengths, and practical limitations.
| MoA method | Best use case | Strengths | Limitations |
|---|---|---|---|
| Affinity chromatography / chemoproteomics | Small molecules with tractable chemistry for immobilization | Direct protein-binding evidence; proteome-wide | Requires synthetic handle; misses indirect targets |
| Thermal proteome profiling (TPP) | Compounds where chemical modification is impractical | No derivatization needed; cell-based | High sample demand; complex data analysis |
| Genetic modifier / CRISPR screens | Hits with a robust, scalable cellular phenotype | Unbiased; identifies pathway context | Slow; requires genetic tools in the model |
| Expression-signature matching (L1000, LINCS) | Rapid hypothesis generation for any hit | Fast; leverages public data | Indirect; hypothesis only, not confirmation |
| Resistance selection | Hits with antiproliferative or antimicrobial activity | Identifies direct targets via mutations | Limited to dividing cells; may select polygenic resistance |
| Computational inference (docking, network analysis) | Prioritizing targets for experimental follow-up | Cheap; rapid; integrates multi-omics | Hypothesis-generating only; requires experimental validation |
The practical guidance: start with expression-signature matching and computational inference because they are fast and cheap, then use the hypotheses they generate to design a targeted affinity or genetic experiment. Running chemoproteomics blind, without a target hypothesis to test, is expensive and often inconclusive.
Pro Tip: Build your MoA portfolio before the primary screen runs. Identify which two or three complementary methods are feasible in your model system, estimate their timelines and costs, and pre-allocate budget. Teams that plan MoA reactively — after hits arrive — lose 3–6 months waiting for assay development or vendor slots.
Phenotypic versus target-based discovery: advantages and limitations
Neither modality is universally superior. The choice depends on what you know about the disease biology and what kind of failure you can afford.
Advantages of phenotypic drug screening:
- Discovers drugs active in a physiologically relevant context, not just against a purified protein
- Captures polypharmacology naturally: a compound that modulates three related targets simultaneously may be more effective than a perfectly selective single-target inhibitor
- Enables target discovery alongside drug discovery, using the compound as a molecular probe
- Avoids the target-validation bottleneck: you do not need to prove a target is causal before screening
- Has a documented track record for first-in-class drugs across multiple therapeutic areas
Limitations:
- MoA determination is resource-intensive and often the rate-limiting step
- Lower throughput than biochemical assays for the same library size, particularly with complex models
- Assay variability is higher in cell-based systems than in purified-protein assays
- Translatability from model to human is not guaranteed, particularly for non-human cell lines or animal models
- Hit rates can be lower in disease-relevant models than in simpler systems, requiring larger libraries or more sensitive readouts
When to favor phenotypic screening:
- Disease biology is poorly understood or the causal target is unknown
- Prior target-based programs in the same indication have failed clinically
- The therapeutic hypothesis requires a functional cellular or organismal response (e.g., neuronal connectivity, immune activation)
- Drug repurposing is the goal
When target-based approaches remain the better choice:
- A well-validated, structurally characterized target exists with a clear mechanistic rationale
- The program requires exquisite selectivity (e.g., kinase inhibitor programs where off-target kinases drive toxicity)
- Speed and throughput are paramount and a biochemical assay is available
Hybrid strategies (mechanism-informed phenotypic drug discovery) are increasingly common: use target-based knowledge to design a disease-relevant phenotypic assay, then screen broadly and use the phenotypic data to discover unexpected chemotypes or polypharmacological profiles that a pure TDD approach would miss.
What do published successes tell us about phenotypic screening?
The clinical track record is the strongest argument for the modality. Three examples from the literature illustrate both the power and the practical lessons.
-
Ivacaftor (VX-770, Kalydeco): discovered through a phenotypic screen measuring CFTR channel function in patient-derived bronchial epithelial cells. The assay used a disease-relevant model (cells from CF patients carrying the G551D mutation) and a readout directly proximal to the clinical phenotype (chloride transport). The compound's MoA as a CFTR potentiator was established after the phenotypic hit was confirmed, not before. This is the "phenotypic rule of 3" in practice: disease-relevant model, disease-relevant stimulus, clinically proximal readout, as described in the Nature Reviews Drug Discovery framework.
-
Risdiplam (Evrysdi): identified through a phenotypic screen for SMN2 splicing correction in patient-derived fibroblasts. The readout was a functional splicing reporter, and the hit-to-lead campaign required extensive MoA work to confirm the compound's mechanism as an RNA splicing modifier. The program demonstrates that phenotypic screens can identify first-in-class mechanisms (RNA splicing modulation) that no target-based approach would have prioritized.
-
Lenalidomide (Revlimid): the MoA (CRBN-mediated degradation of IKZF1/3) was not known at the time of clinical development. The compound was advanced on the basis of its phenotypic effects in myeloma cells. Target identification came years after approval, illustrating both the power of phenotypic discovery and the regulatory reality that MoA can sometimes be established post-approval for serious unmet needs.
The 56% figure for phenotypically discovered first-in-class NMEs is not a historical curiosity. It reflects a structural advantage: when the disease biology is complex, letting the biology select the drug is often more reliable than selecting a target and hoping the biology agrees.
Lessons from these campaigns:
- Disease-relevant models are not a luxury; they are the primary determinant of whether a hit translates
- MoA follow-up requires pre-planned resources, not improvised effort after the fact
- Regulatory agencies (FDA included) have approved drugs with incompletely characterized MoA when the clinical evidence was strong, but this is the exception, not the strategy to plan around
A practical design checklist for your phenotypic campaign
Before running a single compound, work through this checklist. It reflects the phenotypic rule of 3: disease-relevant assay system, disease-relevant stimulus, and readout proximal to the clinical outcome.
Model and assay design:
- Confirm the model recapitulates the disease phenotype (genetic, pharmacological, or physiological induction)
- Validate that the phenotype is stable across at least three independent experiments
- Include a disease-relevant stimulus (e.g., a pathological ligand, a genetic stressor, a metabolic challenge) rather than measuring basal biology
- Choose a readout that maps directly to a clinical endpoint, not a surrogate of a surrogate
Library composition:
- Use well-annotated libraries where possible; annotation accelerates MoA inference
- Include a diversity set if the target space is unknown; include a focused set if a pathway hypothesis exists
- Prefer compounds with molecular weight under 500 Da and good aqueous solubility to reduce false positives from aggregation
QC and replication:
- Set Z' ≥ 0.5 as a plate-level pass criterion; plates below this threshold are repeated, not included
- Include positive controls at multiple concentrations to monitor assay drift over time
- Run pilot screens of a smaller subset of compounds before committing to a full library to validate hit rate and QC metrics
MoA planning:
- Identify two or three complementary MoA methods before the screen runs
- Allocate budget for MoA work at the campaign planning stage, not after hits arrive
- Set explicit MoA decision gates (e.g., "if no credible target hypothesis by week 16, reassess the hit")
Data management:
- Define metadata standards before data collection begins (plate ID, passage number, operator, instrument, date)
- Store raw images and feature matrices, not just summary statistics
- Plan for a data-analysis pipeline that can handle the expected data volume before the screen runs
Pro Tip: Run a pilot screen with 96 or 384 known bioactive compounds before committing to a full library. This validates assay sensitivity, identifies false-positive scaffolds, and gives you a reference set for MoA inference — all for a fraction of the cost of discovering the same problems mid-campaign.
How long does a phenotypic campaign take, and what does it cost?
Timelines and costs vary substantially by model complexity, library size, readout technology, and MoA strategy. These ranges reflect typical U.S. academic and industry programs; CRO-based campaigns can compress timelines but add vendor management overhead.
Pilot screen (1,000–10,000 compounds, simple cell-based assay):
- Timeline: 4–8 weeks from assay lock to primary hit list
- Cost drivers: assay development, compound plating, imaging instrument time, data analysis
- Typical cost range: $50,000–$150,000 depending on readout complexity and model
Medium-scale screen (10,000–100,000 compounds, HCI readout):
- Timeline: 3–6 months including hit triage and orthogonal validation
- Cost drivers: library access or licensing, HCI instrument time, image analysis compute, ADME/Tox panels
- Typical cost range: $200,000–$600,000
Industrial-scale screen (> 100,000 compounds, complex model such as organoids or iPSC-derived cells):
- Timeline: 6–18 months from assay development through confirmed leads
- Cost drivers: model development and QC, library management, high-content imaging at scale, MoA campaign (often $200,000–$500,000 alone)
- Typical cost range: $1,000,000 and above
MoA campaign (standalone, following a completed screen):
- Timeline: 3–12 months depending on methods selected and target complexity
- Cost drivers: chemoproteomics synthesis and proteomics runs, CRISPR library screens, RNA-seq profiling, computational analysis
Caveats: these ranges assume U.S. pricing for reagents, instruments, and personnel. Costs also shift significantly based on whether the team has existing infrastructure or is building from scratch.
What should your computational team deliver, and when?
Computational integration is not a post-screen analysis step. It is a parallel workstream that should begin when assay development begins. High-dimensional phenotype representations, ML, and public datasets make phenotypic screening more systematic — but only when the data infrastructure is in place before the data arrives.
Computational deliverables by campaign stage:
- Pre-screen: data schema and metadata standards, QC pipeline for plate-level metrics (Z', %CV, signal drift), compound library annotation and clustering, baseline feature extraction protocol for the chosen readout
- During primary screen: automated QC reports per plate batch, real-time hit flagging against predefined thresholds, batch-correction monitoring
- Post-primary screen: normalized feature matrices, dimensionality reduction (UMAP, PCA) visualizations, nearest-neighbor clustering against reference compound databases (JUMP-CP, LINCS L1000), ranked hit lists with confidence scores
- Hit triage: ML-based PAINS and aggregator flagging, CRC fitting and outlier detection, integration of ADME/Tox data into hit scoring
- MoA inference: expression-signature matching against L1000 or CMap, network analysis for pathway enrichment, docking-based target prioritization for computational inference
Practical recommendations for experimenters:
- Capture passage number, cell density, media lot, and instrument ID for every plate; these metadata fields are the first variables a computational analyst will need to explain batch effects
- Store raw images, not just extracted features; image re-analysis with improved algorithms is often necessary 12–18 months into a program
- Agree on a hit-scoring rubric with the computational team before the screen runs, not after
Pro Tip: Involve your computational analyst in assay design, not just data analysis. The choice between a single-channel viability readout and a six-channel Cell Painting assay has enormous downstream implications for what MoA hypotheses you can generate. That decision should be made with full awareness of the analysis pipeline it requires.
For teams building ML workflows for drug discovery or integrating AI-driven approaches into phenotypic data analysis, the architecture decisions made at the start of a campaign determine how much biological signal you can extract from the data you collect.
Common pitfalls in phenotypic campaigns and how to avoid them
Most phenotypic campaign failures are predictable. The same errors appear repeatedly across programs, and most are avoidable with upfront planning.
-
Poor model choice: using a convenient cell line instead of a disease-relevant model because it is faster to establish. Mitigation: validate that the model recapitulates at least two independent disease-relevant phenotypes before committing to a screen.
-
Gain-of-signal assay neglect: defaulting to loss-of-signal assays (e.g., cell death inhibition) without adequate counterscreens for cytotoxicity. Gain-of-signal phenotypes reduce the likelihood of misidentifying cytotoxic compounds as true positives. Mitigation: design the primary assay around a positive signal where the biology allows it.
-
Inadequate counterscreens: skipping assay-interference tests because the primary screen looks clean. Mitigation: run luciferase interference, aggregation, and redox counterscreens on every confirmed hit before advancing.
-
No pre-planned MoA strategy: treating target deconvolution as someone else's problem to solve after hits arrive. Mitigation: write the MoA plan before the primary screen runs and include it in the campaign budget.
-
Over-reliance on throughput: choosing a model or readout primarily because it scales to 384-well or 1536-well format, even when the biology is not well represented at that scale. Mitigation: run a pilot in the high-throughput format and confirm that the phenotype and hit rate match the lower-throughput validation format.
-
Ignoring batch effects: treating all plates as equivalent without monitoring for reagent lot changes, passage drift, or instrument variation. Mitigation: include inter-plate controls and run batch-correction analysis before any hit calling.
-
Weak data reproducibility documentation: the FDA's expectations for data integrity (21 CFR Part 11 for electronic records, GLP for regulatory submissions) require that raw data, metadata, and analysis steps are fully traceable. Mitigation: implement an electronic lab notebook and a version-controlled analysis pipeline from day one, even for early-stage discovery work.
A researcher's perspective on what actually matters in phenotypic campaigns
The most persistent misconception in phenotypic drug discovery is that the hard part is the screen. It is not. Running a 50,000-compound screen against a well-developed cell-based assay is operationally demanding but technically solved. The hard part is everything that comes after: confirming that a hit is real, understanding why it works, and building enough mechanistic confidence to justify the investment in lead optimization.
Teams that succeed at phenotypic discovery share one habit: they treat MoA determination as a parallel workstream, not a sequential one. They do not finish the screen and then ask "now what?" They enter the screen with two or three MoA methods already validated in their model system, with reagents ordered and timelines set. When hits arrive, the MoA campaign starts within weeks, not months.
The second thing that separates successful programs is model discipline. The temptation to use a convenient cell line because it grows fast and plates easily is understandable. But a hit that is active in HEK293 cells and inactive in patient-derived neurons is not a drug candidate; it is a result that will cost you 12 months to understand. Choosing a disease-relevant model from the start, even when it is harder to work with, is the decision that most often determines whether a phenotypic program produces a clinical candidate or a publication.
Computational integration is the third lever that is consistently underused. The data generated by a Cell Painting screen or a transcriptomic profiling experiment contains far more biological information than most teams extract. Bringing a computational analyst into the assay design conversation, not just the data analysis conversation, changes what questions you can answer with the data you collect.
Phenotypic screening support from Innovabiotech
Phenotypic campaigns generate data at a scale and complexity that most wet-lab teams are not staffed to analyze alone. Innovabiotech provides the computational infrastructure to make that data work harder.
The team at Innovabiotech delivers end-to-end bioinformatics support for phenotypic programs: normalized feature matrices from high-content imaging runs, ML-based signature matching against public reference databases, MoA inference pipelines integrating expression profiling and network analysis, and hit-scoring frameworks that incorporate ADME/Tox data alongside phenotypic activity. For programs that extend into lead optimization, Innovabiotech's virtual screening and hit-to-lead services connect phenotypic hits to structure-based design workflows, and the protein engineering capabilities support tool compound and probe development for target validation. Every engagement is project-scoped, confidential, and built around the specific biology of your program. Contact Innovabiotech to discuss what computational support your phenotypic campaign needs.
Sources
- Phenotypic screening: a powerful tool for drug discovery — Technology Networks
- Phenotypic Drug Discovery: Recent successes, lessons learned and new directions — PMC
- Phenotypic drug discovery: recent successes, lessons learned and new directions | Nature Reviews Drug Discovery
- Phenotypic screening in the 21st century — Frontiers in Pharmacology
FAQ
What is phenotypic drug screening?
Phenotypic drug screening identifies bioactive compounds by observing their functional effects on cells, organoids, or model organisms without requiring a predefined molecular target. The approach lets biology determine which molecules are worth pursuing, with MoA determination following as a required downstream step.
What is an example of a phenotypic screen?
Ivacaftor was discovered through a phenotypic screen measuring CFTR chloride channel function in bronchial epithelial cells from cystic fibrosis patients carrying the G551D mutation. The compound's MoA as a CFTR potentiator was established after the phenotypic hit was confirmed, not before.
What is the difference between target-based and phenotypic drug discovery?
Target-based discovery starts with a defined molecular target (a protein, enzyme, or receptor) and screens for compounds that bind or modulate it. Phenotypic discovery starts with a disease-relevant biological system and screens for compounds that change its behavior, with the target identified afterward. Among first-in-class NMEs approved between 1999 and 2008, 56% came from phenotypic approaches, not target-based design.
What is a phenotypic drug?
A phenotypic drug is a compound identified and advanced based on its functional effect in a disease-relevant biological system, rather than its activity against a specific molecular target. Many approved drugs, including risdiplam and lenalidomide, were phenotypic discoveries whose molecular targets were characterized after clinical development began.
How do you determine the mechanism of action after a phenotypic hit?
No single method is sufficient. Successful MoA campaigns use complementary approaches including affinity-based chemoproteomics, thermal proteome profiling, CRISPR genetic modifier screens, expression-signature matching against databases like LINCS L1000, and computational target inference. Starting with fast, low-cost methods (expression profiling, computational docking) to generate hypotheses, then confirming with affinity or genetic experiments, is the most resource-efficient sequence.