
Ligand efficiency metrics are normalized ratios, mainly LE, LipE (also called LLE), BEI, group efficiency, and LipMetE, that divide binding potency by a cost variable such as heavy atom count, molecular weight, or lipophilicity. The bottom line: no single metric is a pass/fail gate. Use them comparatively within a chemical series, track their trend as you optimize, and treat any published threshold, like the IUPAC reference of roughly 1.25 kJ/mol per heavy atom, as a sanity check rather than a hard cutoff.
TL;DR:
- Ligand efficiency metrics like LE and LipE should be used to compare compounds within a series, not as strict pass/fail thresholds, with benchmarks such as 1.25 kJ/mol per heavy atom serving as rough guidelines.
- Accurate calculation of these metrics requires consistent assay formats, concentration units, and reliable LogP sources, as mixing data types can distort results.
- LE is most useful for small fragments, while LipE helps identify whether potency gains come from true binding or increased lipophilicity, especially during lead optimization.
- Tracking trends in efficiency metrics within a series provides more actionable insights than single compound scores, emphasizing the importance of systematic data logging and consistency.
- Overinterpreting lower LE values in larger molecules without size normalization can lead to misjudging molecular quality, making size-adjusted analysis essential.
Table of Contents
- Ligand Efficiency Metrics: Formulas and Units
- How to Calculate Ligand Efficiency and LipE Step by Step
- LE vs. BEI vs. LipE: Choosing the Right Metric by Project Stage
- Building Ligand Optimization Strategies Around Efficiency Metrics
- Where Ligand Efficiency Metrics Break Down
- How Innovabiotech Applies Ligand Efficiency Metrics in Practice
- What Medicinal Chemists Get Wrong About Ligand Efficiency
- Sources
- FAQ
Ligand Efficiency Metrics: Formulas and Units
Every metric in this family answers the same question with a different denominator: how much binding energy are you getting per unit of structural or physicochemical "cost"?
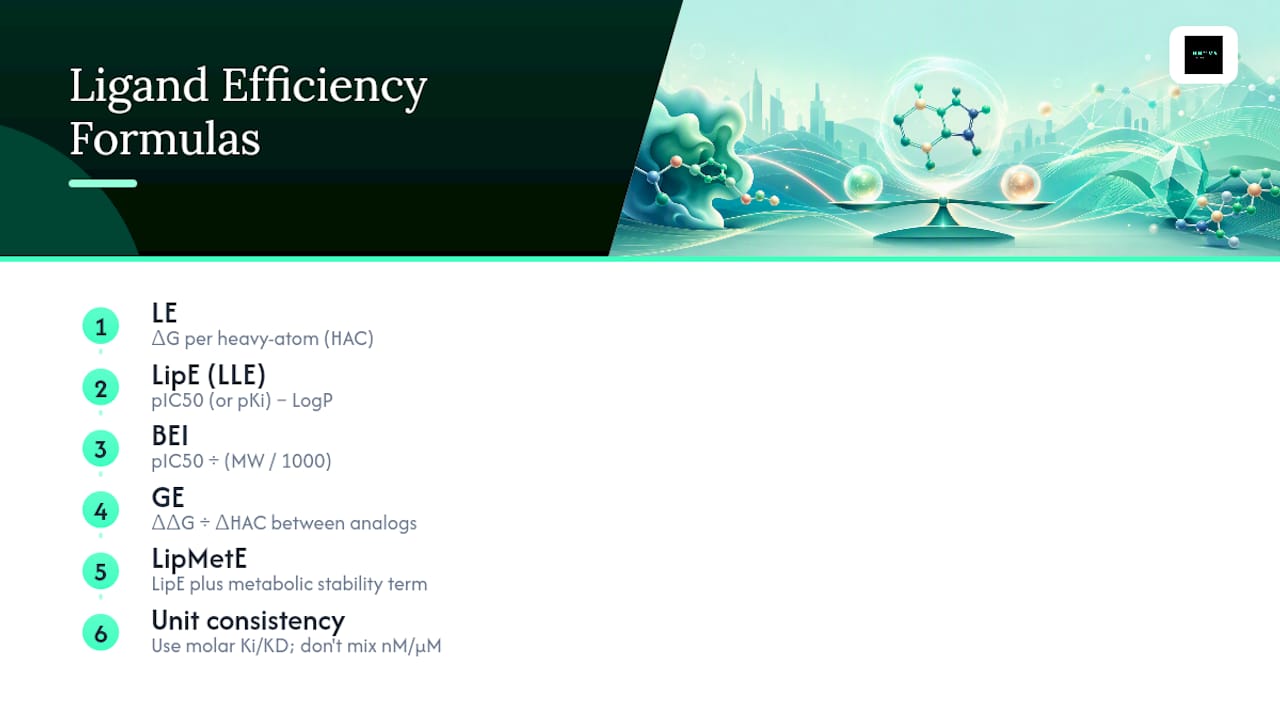
Ligand efficiency (LE) divides binding free energy by heavy atom count (HAC): LE = ΔG / HAC, where ΔG = −RT ln(K) and K is the binding constant (Ki or KD) in molar units. IUPAC's own phrasing frames LE as Gibbs free energy of binding per non-hydrogen atom, with about 1.25 kJ/mol per heavy atom cited as a minimum benchmark for a promising fragment or lead.
LipE (or LLE) trades ΔG for a simpler, more intuitive form: LipE = pIC50 (or pKi) − LogP. Some groups substitute LogD at physiological pH for LogP, which matters for ionizable compounds; mixing the two within one dataset quietly corrupts every comparison you make later.
BEI (binding efficiency index) swaps heavy atom count for molecular weight: BEI = pIC50 / (MW / 1000).
Group efficiency (GE) isolates the contribution of a specific substituent or fragment: GE = ΔΔG / ΔHAC between two matched analogs.
LipMetE extends LipE by incorporating a metabolic stability term, usually intrinsic clearance or microsomal half-life, alongside potency and LogP, giving medicinal chemists a single number that penalizes both greasy, low-efficiency binders and metabolically fragile ones.
The recurring trap across all five: ΔG calculations demand molar (or at least strictly consistent) concentration units. Mixing nanomolar Ki values from one assay with micromolar IC50 values from another will silently distort every LE value you compute downstream.
How to Calculate Ligand Efficiency and LipE Step by Step
Start with a Ki (or convert IC50 to Ki using the Cheng-Prusoff equation if substrate concentration and Km are known). Suppose a fragment binds with Ki = 10 µM (1 × 10⁻⁵ M) and has 15 heavy atoms.
- Convert Ki to ΔG: ΔG = −RT ln(K), with R = 8.314 J/mol·K and T = 298 K. Using K = 1/Ki = 1 × 10⁵ M⁻¹, ΔG = −(8.314)(298) ln(1 × 10⁵) ≈ −28.5 kJ/mol.
- Divide by heavy atom count: LE = 28.5 / 15 ≈ 1.90 kJ/mol per heavy atom.
- Compare against the roughly 1.25 kJ/mol per heavy atom reference IUPAC cites as a floor for a competitive fragment. This compound clears it comfortably.
Statistic to remember: in a retrospective survey of marketed oral drugs, only a small fraction of molecules exceeded combined LE and LipE benchmarks simultaneously, which tells you these two metrics filter hard, and clearing both at once is genuinely rare.
For LipE, the arithmetic is lighter. Take a compound with IC50 = 50 nM (pIC50 = 7.30) and LogP = 3.1. LipE = 7.30 − 3.1 = 4.20. Now compare a matched analog where a methyl group raises potency to IC50 = 20 nM (pIC50 = 7.70) but also raises LogP to 3.8: LipE = 7.70 − 3.8 = 3.90. Potency improved, but LipE dropped, a classic sign the gain came from greasiness, not genuine target complementarity.
Before trusting any of these numbers, confirm the assay format is consistent (biochemical vs. cellular), the LogP source is uniform (calculated vs. measured), and Ki/IC50 values weren't pooled across incompatible conditions.
LE vs. BEI vs. LipE: Choosing the Right Metric by Project Stage
LE and BEI look similar but drift apart as molecules grow. LE normalizes by heavy atom count, so it stays informative for small fragments where every atom matters. BEI normalizes by molecular weight, which makes it more forgiving of heteroatom-heavy or halogenated series where atom count and mass diverge. Neither is more "correct," they answer slightly different questions about the same molecule.
- Fragments (under 300 Da): lean on LE. Small changes in HAC swing the ratio meaningfully, which is exactly the sensitivity you want at this stage.
- Hits and early leads: LipE earns its keep here, because the real risk at this stage is chasing potency by piling on lipophilicity, a shortcut that quietly wrecks solubility and clearance later.
- Lead optimization: LipMetE becomes the more honest number once metabolic liabilities show up in microsomal or hepatocyte data, since it folds clearance risk directly into the efficiency score.
- Fragment-to-lead transitions: group efficiency helps rank which specific substituent additions are actually earning their structural cost.
Pro Tip: Don't chase a single "good" LipE or LE number in isolation. Some researchers frame these indices as vectors, with both a magnitude and a direction across a series, which matters more than any single-point value ever will.
Building Ligand Optimization Strategies Around Efficiency Metrics
Turning these metrics into working discipline, not just retrospective commentary, takes a few concrete habits.
- Benchmark early and log every analog. Compute LE and LipE for your first tractable hit and treat that value as the series baseline, not an absolute standard borrowed from another program.
- Plot LogP against pIC50 for the whole series, then draw the diagonal lines representing constant LipE values (commonly LipE = 5, 6, 7). Compounds drifting below the LipE = 6 line as potency rises are gaining affinity through lipophilicity, not molecular recognition.
- Cross-reference metric flags against ADME data rather than optimizing metrics in isolation. A compound with strong LipE but poor microsomal stability needs LipMetE-style thinking, not a victory lap.
- Apply a simple decision rule: if potency gains are outpacing LipE (LogP climbing faster than pIC50), consider trimming non-contributory atoms instead of adding more mass to chase affinity. Reduction-focused redesign frequently produces better clinical candidates than another round of "bigger is better" analog synthesis, based on lessons from recent lipophilic efficiency reviews.
Selectivity panels deserve the same lens: a compound that gained potency against your primary target by adding lipophilic bulk often gained off-target affinity too, so a LipE drop is frequently an early warning for selectivity problems before the panel data even comes back.
Where Ligand Efficiency Metrics Break Down
"Ligand efficiency indices...should be understood as weight-normalized properties, not as immutable descriptors of molecular quality." That reframing, from a peer-reviewed statistical analysis of LE, explains why LE tends to fall as molecular weight rises: the relationship is mathematically hyperbolic (roughly 1/MW), not a real chemistry signal about declining binding quality.
That single insight resolves a lot of confusion. Larger molecules don't necessarily bind worse, they mathematically can't sustain high LE values because heavy atom count grows faster than binding energy typically does. Treating a lower LE on a bigger lead as a red flag, without adjusting for size, is a common misread.
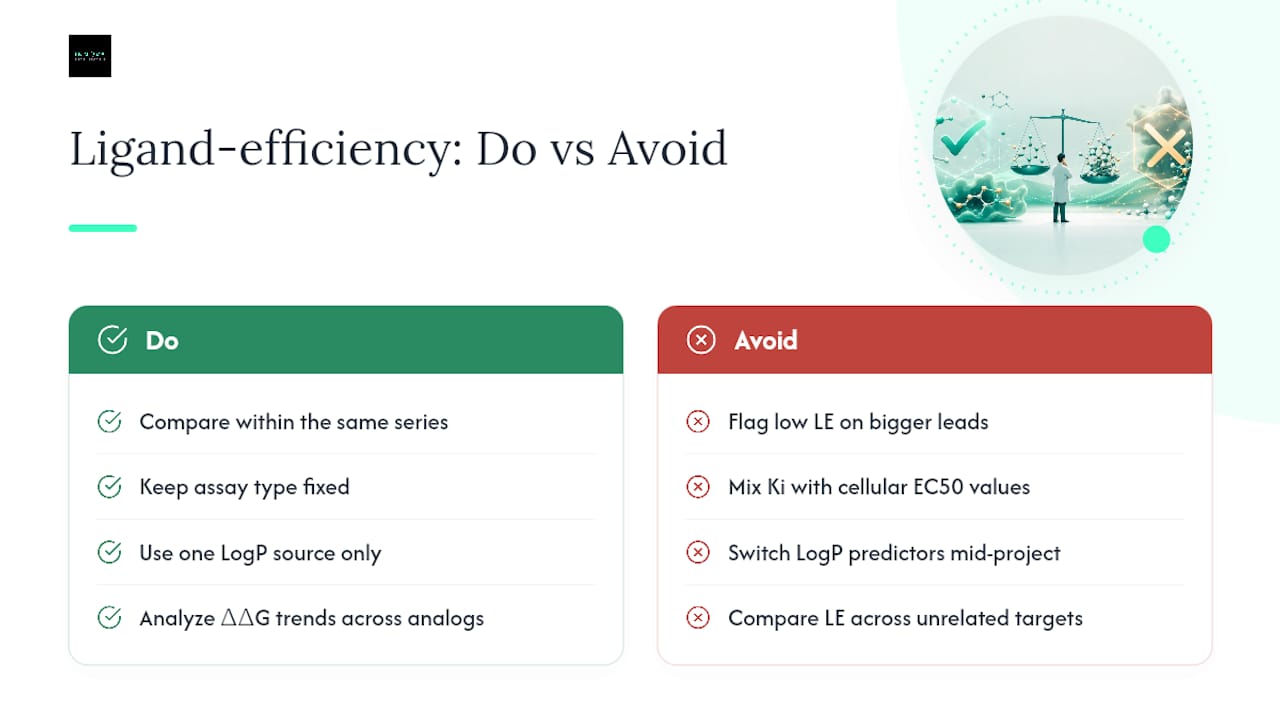
Other pitfalls stack on top of that one: mixing enzymatic Ki values with cellular EC50 data, pulling LogP from different prediction software mid-project, or comparing LE across unrelated targets as if it were a universal potency scale. The fix is unglamorous but effective: stick to within-series comparisons, fix your assay type and LogP source for the life of the project, and treat ΔΔG trends across analogs as more meaningful than any single absolute ΔG number.
How Innovabiotech Applies Ligand Efficiency Metrics in Practice
Reproducibility is the quiet failure point in most efficiency-metric workflows. A spreadsheet with mixed IC50 and Ki columns, or a LogP value pulled from three different tools across one series, will produce numbers that look precise and mean nothing.
Computational teams build unit-consistency checks directly into hit-to-lead pipelines: fixed concentration units, a single LogP/LogD source per project, and version-controlled scripts rather than one-off spreadsheet math. Community calculators are useful for a quick gut-check on a handful of compounds, but once a series grows past a few dozen analogs, an in-house pipeline that logs assumptions alongside results becomes the safer choice. In one optimization exercise, flagging a declining LipE trend early redirected the design strategy toward atom trimming rather than further potency-chasing, a shift that improved the series' overall efficiency profile within a few design cycles.
What Medicinal Chemists Get Wrong About Ligand Efficiency
The conventional advice treats ligand efficiency metrics like exam scores, hit a number, pass the gate, move the compound forward. That framing has always been backwards. LE and BEI are weight-normalized ratios shaped by a mathematical 1/MW relationship, not clean measures of chemical elegance, and a fragment scoring 1.9 kJ/mol per heavy atom isn't inherently smarter chemistry than a 400 Da lead scoring 1.4.
What actually matters is the trend within your own series. A LipE climbing from 4 to 6 across four analogs tells you more about where your chemistry is heading than any single compound's absolute score ever will. Where most teams underinvest is in unit hygiene, the boring work of fixing assay type, LogP source, and concentration units for the life of a project. That discipline, not a fancier formula, is what separates a metric that guides real decisions from one that just decorates a med-chem report.
Prioritize consistency before sophistication. A simple LE and LipE tracked rigorously across matched analogs will outperform a more elaborate composite score computed carelessly.
— Hooman
Sources
Start with the IUPAC Gold Book entry on ligand efficiency for the formal definition and reference value. For broader context on adoption and application, this widely cited review covers how LE and LipE metrics get used across fragment-to-lead campaigns. The statistical critique of LE is essential reading before you overinterpret any single value. For LipE and LipMetE specifically, see the J. Med. Chem. review. Innovabiotech's own posts on hit-to-lead optimization and fragment-based drug discovery go deeper on where these metrics fit operationally.
- IUPAC Gold Book — ligand efficiency
- Ligand efficiency indices: chemical meaning and statistical interpretation
FAQ
How Is Ligand Efficiency Calculated?
LE equals the binding free energy (ΔG, derived from Ki via ΔG = −RT ln K) divided by the number of heavy atoms in the ligand. A compound with ΔG of −28.5 kJ/mol and 15 heavy atoms has an LE of about 1.90 kJ/mol per heavy atom.
What Is a Good LogP for a Drug?
Most oral drug candidates target a LogP between 1 and 3, since values much above 3 tend to correlate with poor solubility, higher clearance, and off-target binding. LipE calculations use LogP directly, so keeping it in this range while maintaining potency usually keeps LipE favorable.
What Is a Good Binding Affinity Score?
There's no single universal number, affinity has to be judged alongside efficiency. A compound with nanomolar Ki but weak LE or LipE may be less developable than a micromolar hit with strong efficiency values, since the latter has more room to gain potency without sacrificing drug-like properties.
What Does a LogP of 2 Mean?
A LogP of 2 means a compound is more soluble in octanol (a lipid proxy) than in water, placing it in a moderately lipophilic range that generally supports good membrane permeability without the solubility and metabolism problems seen above LogP 4 or 5.